Four-Year Toronto Price Graph (All Home Types)
  
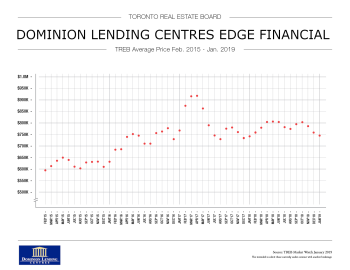
The Toronto Real Estate Board releases the average price of all Toronto homes every month. For your viewing pleasure it is in this graph format.
I love this graph because it shows just how crazy the price appreciation was in 2016 and the beginning of 2017. The rest of the graph shows seasonal changes in pricing. Up in the spring, down in the summer, up in the fall and down in the winter.
|
|
|
|