Power of Sales and Foreclosures
  
Power of Sales Aurora
Power of Sales Barrie
Power of Sales Brampton
Power of Sales Clarington
Power of Sale Galway-Cavendish and Harvey
Power of Sales Georgina
Power of Sales Hamilton
Power of Sales Innisfil
Power of Sales Kawartha Lakes
Power of Sales Markham
Power of Sales Milton
Power of Sales Mississauga
Power of Sales Newmarket
Power of Sales Oakville
Power of Sales Oshawa
Power of Sales Richmond Hill
Power of Sales Toronto
Power of Sales Vaughan
Power of Sales Whitby
Power of Sales Whitchurch-Stouffville
Are Rates Going to Increase?

Rates are probably not going to increase over the next couple of months.
Bond Rates are a wonderful predictor of our mortgage rates. Since November, the five-year bond rate has decreased by 0.7%. Assuming the bond rates remain in this range, we should see rates decrease accordingly over the next two months.
Rates have actually started to come down already, and the forecast for any rate increases by the Bank of Canada in 2019 have substantially decreased. As recently as October 2018, some experts were predicting as many as three more increases of .25% on the Prime Lending Rate. This would raise the payment for a $500,000 variable mortgage by almost $200 per month. Again, this isn't as likely now.
Some economists have actually started to predict the Bank of Canada to cut rates! I'm not so sure that is going to happen soon, but it is certainly possible if oil prices decrease further or the US economy falters. We send so much of our exports to the US, that if they slow down, we slow down. A rate decrease would encourage people to spend more and save less, which could help to buoy the economy through rough waters.
You can bet that some lenders will look to offer promotions to capture business in the Spring. Stay tuned and talk to me if your mortgage is up for renewal or you're looking to buy.
Four-Year Toronto Price Graph (All Home Types)
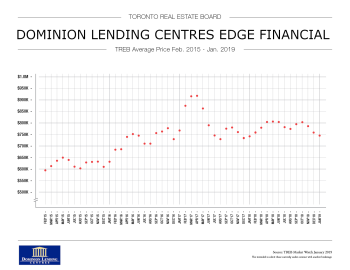
The Toronto Real Estate Board releases the average price of all Toronto homes every month. For your viewing pleasure it is in this graph format.
I love this graph because it shows just how crazy the price appreciation was in 2016 and the beginning of 2017. The rest of the graph shows seasonal changes in pricing. Up in the spring, down in the summer, up in the fall and down in the winter.
|